Showing posts with label math skills. Show all posts

Monday, April 25, 2011

Smart Stuff with Twig Walkingstick: Backyard Fruits that You Can Grow

Twig Walkingstick lives in and around the Wooster campus of the Ohio Agricultural Research and Development Center. His alter ego is Kurt Knebusch, one of our super-talented writers and editors on campus. Each month, look for Twig to answer a reader questions and some additional interesting facts below. After Twig's post, we will be providing some ideas and suggestions on how to incorporate the info in Twig's column into fun science learning for your students and children.

Q. Dear Twig: OK, here's another kiwifruit. So what did you mean, "more cool backyard fruits" last month?

A. Thank you. Chomp, chomp. I meant that you can grow a lot of other fruits in your own backyard, not just kiwifruits. (And you can grow those, too, if you want to.)

Like what? Well, in most places you can grow apples.

And peaches.

And pears and plums.

And grapes and cherries and peaches and apricots.

Strawberries, blueberries, raspberries, blackberries.

Plus weird ones, too, that you might not find in a grocery store: pawpaws, currants, mulberries, Juneberries, gooseberries, even ground cherries.

Sweet.

Next: Why would you want to do this? A good way to learn how to do this. And a chance to win that good way free.

Berrily,

Twig

P.S. Q. Why do elephants hide in strawberry patches? A. The research is inconclusive.

Notes from Twig:

The fruit types listed are for Midwestern growing conditions (like in Ohio, where I live). Others include quince, medlar, bush cherry, Cornelian cherry, persimmon and highbush cranberry.

Source: If you're eager to learn, check out Ohioline and start to dig around.

Q. Why do elephants paint their toenails red? A. To hide in a strawberry patch or in plantings of certain kinds of grapes, apples, cherries, currants, raspberries, gooseberries, mulberries, bush cherries or highbush cranberries depending on the shade they use.


Using this information in the classroom:

There are many, many cool ways to incorporate plants into your classroom. Here are two of our favorites:

Check out Growing Together, which you can buy at the Ohio State University Extension E-Store for $13.50. There are tons of cool activities and lessons inside and we use them in our program all the time. Love it!

And secondly, I bet you don't think of using plant to teach math, do you? Check out Math in the Garden for $29.95 from Gardening with Kids.


Lots of fun, hands-on ways to heat up your outdoor summer learning in the coming months of spring and summer. Enjoy!

Monday, December 13, 2010

Dreaming of a white Christmas?

Are you (and your little learners) dreaming of a white Christmas? How about if you take those dreams and turn them into predictions?

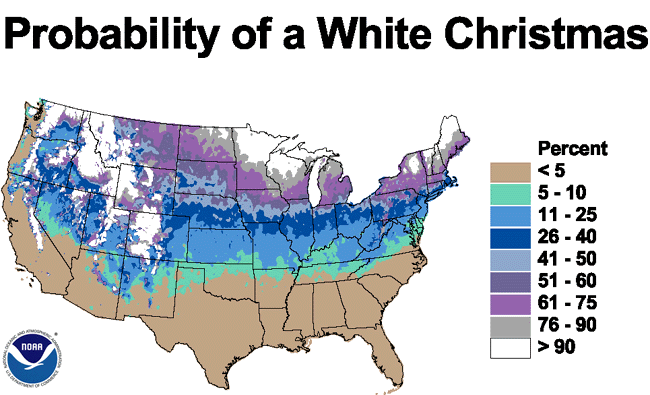
Here at OARDC we have an active weather station at our Wooster campus, and at 17 other sites across the Buckeye State. Current and past data for these stations is available free of charge online. So you can certainly check our weather at anytime, but that still leaves the question: will we have a white Christmas this year? Here's a fun way for older elementary to high school students to use historical weather data to create a map and color key to illustrate the likelihood of a white Christmas while learning about contour maps. The following lesson plan is based on the lesson available at educationworld.com
The National Climatic Data Center has calculated the probability of a White Christmas for the entire US (below). This map is based on the full range of data for each site rather than the 1971-2000 normal.

Here's what you'll need:

  • A color temperature map (many newspapers like USA Today publish such a map daily and are even available online)
  • Recording of the song I'm Dreaming of a White Christmas  (optional)
  • White Christmas Weather Data worksheet available free online
  • US outline map available free online
  • Atlas
  • Crayons or colored pencils
Will your students enjoy a white Christmas this year? Let's see what the historical weather data has to say about the likelihood for your part of the country...
  1. Start by showing students a color temperature map. Discuss how the map can be a quick guide to determine the current or high temperature for the day. Point out the color key as a tool to guide interpretation of the map.
  2. Ask students if they have any idea how this map, called a temperature contour map, is created. The color contour map is imply a pictorial representation of weather data. In the case of a contour map that shows the current temperatures around the United States, the data is a long list of temperatures in cities around the country. Students could create their own color contour map by gathering this data, plotting the temperatures in a wide variety of locations on an outline map and "connecting the dots" to approximate the approximate areas in which the temperatures are in the 20s, 30s, 40s, 50s, etc.
  3. For practice, you may want to provide students with data from a local paper on temperatures recorded the previous day or the high temperature estimate for the current day. Use the list to plot locations and temperatures. Demonstrate how students can create a color contour map to show those high temperatures. Then have students map the low temperatures of the day from the same source.
  4. Introduce and play the song I'm Dreaming of a White Christmas and pass out the White Christmas Weather Data worksheet. This worksheet includes figures representing the percent likelihood of snow being on the ground Christmas Day in 40 cities around the United States. This worksheet is intended for grades 5 and up. Younger students can focus on a state or region and map data for that smaller area. For example, the Illinois State Climatologist Office provides data for 13 sites across Illinois on the likelihood of snow on Christmas day. You may be able to find similar data for your state or region as well. Stormfax also provides a nice set of data for various states and regions.
  5. Have students plot the data on their map then create a color key to guide them as they color their contour maps. The color key will denote a different color for locations where the percent likelihood of snow on Christmas day is 0-20 percent, 21-40 percent, 41-60 percent, 61-80 percent and 81-100 percent. Be sure students understand that the maps they create are a simple approximation of the likelihood any area will have an inch of snow or more on the ground Christmas day. Geographic location can account for vast differences in snowfall in a small area. For example, their map will show that much of Arizona has little chance of snow cover on Christmas day, but a small area of the state, around the city of Flagstaff ( located in the mountains in the middle of the state) has a 57 percent chance of snow coverage on Christmas day!
  6. Have students share their maps with one another and with the class and discuss how accurately those maps depict the likelihood of snow cover. Check maps for accuracy in plotting city locations, but grant leeway in judging the final contour maps. Some variation needs to be allowed for where the controus might break between the plotted cities. Students should also have the opportunity to express in writing thelessons they learn (math and geography) from the activity.

Monday, November 29, 2010

Tree-rific math!

This month I'm gearing up for a big lesson on Christmas trees with about 200 preschoolers. Lucky me, right? But as I was out looking for "the perfect idea" for sharing about the role of Christmas trees and Christmas tree farmers with my preschool crowd, I found a cool resource for teaching real-life mathematics to older students using Christmas trees!

Photo from the United States Department of Agriculture
Natural Resource Conservation Service
The lesson comes from the Massachusetts Christmas Tree Association, and they offer an educational package free of charge (you just pay $5 for shipping) called The Annual Cycle of the Tree Farmer. If the rest of the materials are as cool as this fun, hands-on lesson, the $5 shipping fee is a steal!

Students will develop and understanding of area,the size of an acre and spatial relationships as well as learn different strategies for determining land area of irregular polygons in this lesson designed for students in grades 6 and up (adaptations for younger students are included at the end of this lesson).

The assignment revolves around this scenario:

Mr. & Mrs. Rice recently sold their dairy her and want to convert their former pasture land into a tree farm. They have a map of their property that shows the pasture land. Literature from the Massachusetts Cooperative Extension agent about growing evergreen trees suggests that trees can be successfully grown in a 6' x 6' arrangement with trees planted 6' apart in rows that are 6' apart. With this arrangement, 1,200 trees can be planted per acre of pasture land. An acre is a surface are of 43,560 feet.

Side note: I love the name Rice used in the scenario above! The land where our OARDC campus is located originally belonged to the Frederick Rice family. Frederick was a veteran of the Revolutionary War and eventually divided the farm between his two sons Simon and Barnhardt.


Question for students to answer: How many trees can the Rice family plant in their former cow pasture? A map of the property is included in The Annual Cycle of the Tree Farmer package.

Suggestions for teaching:

  1. Take the students outside and measure an acre on your school or personal property to help them understand how large an acre actually is. Before going outside, explain that since the square footage of an acre is 43,560 feet, the easiest way to measure out an acre is to create a square or rectangle with an area this size (Area = Length x Width, and in this case the area would be 43,560). Have students experiment in the classroom with calculators to find what combination yields a product of 43,560. Just a few of the possible solutions include: 208.47 x 208.47, 10 x 4,356, 100 x 435.6, 150 x 290.4, etc. Students should discover that the width will always equal the area (43,560 feet) divided by whatever length they choose. The students can then be divided into groups of 4 to go outside, measure and stake out the bounds of their acre using different dimensions for each group. This will help them understand that several different polygons can have the same area (in this case, 1 acre).
  2. Divide the students into groups of 3-4 and distribute the maps of the farm showing the pasture land that is to be planted to trees. Focus on 1 pasture and show it on an overhead. Give students 5 minute to discuss with their group possible ways to find the square footage of this pasture, then present their solutions. If using the map included with the Annual Life Cycle of a Tree Farmer, the lengths on that map have been converted to actual lengths using the map scale, where 1 inch = 100 feet. If you don't have the Annual Life Cycle of a Tree Farmer, you can create your own map selecting pasture shapes appropriate to the age level of your students. Perhaps the pasture shape is a trapezoid (calculate the area by dividing it into 2 triangles and a rectangle, then add the areas together) or a series of different shaped rectangles
These are fun, hands-on ways to help students learn about basic mathematical concepts and real-life problem solving. Which is always a good idea when it comes to minimizing the "But why do I have to learn my math?" questions! 

Monday, July 12, 2010

Take a hike!

Summer is a great time to get out and about and enjoy nature with children...they see so many wonders we as adults often miss! So cast your cares to the wind and make time to enjoy the outdoors...and while you're at it, make it a fun time to learn, too!

Scavenger hunts outdoors are great fun. Plus, they enhance kids' abilities to correctly use and identify directional words like near, far, above, below, left, right, etc., as they participate in the excitement of the hunt. So not only will kids have fun hunting for nature objects (enhancing their knowledge of the natural world and developing science skills), but they also practice determining an object's location (spatial awareness and location are good math skills).

The following activity was adapted from Embark on a Math and Science Hunt. They have tons of cool year-round science ideas for each grade there, plus they have a neat 2010 Summer Activity Challenge where you can keep track of all the cool learning activities you do this summer.

First, determine your destination. Haven't been hiking in a while? No worries. Both national and state forest services have tons of resources online for both beginning and advanced hikers. Or, call your local parks and recreation department for suggestions. In fact, here's a list of suggestions for Ohio hiking destinations.

If you are in our neck of the woods (literally) in northeast Ohio, we invite you to come visit Secrest Arboretum. Our 90-acre research arboretum is home to numerous varieties and cultivars of trees and plants and has plenty of walking trails to keep you busy. We are open to the public free of charge seven days a week during daylight hours.

Once you've selected a destination, gather your supplies:

  • Several pieces of card stock (8.5 x 11" is a good size)
  • Pictures of flowers, lichen, trees, insects, flowers, etc. that are to be found on the hike. Printing off pictures from the internet is great. The possibilities are endless.
  • Crayons
  • Adventure pack
  • Small plastic storage bags
Once your supplies are together, create your Adventure Pack. Do a little online research to learn about the flora and fauna in and around your destination. Find pictures of some fun and unusual things, like flowers with funny names (how about "sticky monkey flower"?) or unusual items like cool fungus or colorful bark.
Print the pictures, cut them out, and attach them to the card stock. Then label them along with the name, description and any unusual facts. You can even make these into clue cards if you want, putting the picture and name on one side of the card and the description and location clues on the reverse side.

If you have the chance, it's always a good idea to take your cards out for a kid-free test drive (granted, this may not work for you if you're going somewhere farther from home...but it's a good idea none the less). Look for each of the items you've identified and write down location clues to help the kids locate them.

Another strategy that would work well if you are able to take a prep hike without the kids is to take along a camera to photograph cool finds. You can write down location clues and look up cool facts about what you found once you return home. 

Finally, sell the adventure to your kids and take off on an exciting hunt! A story is only as good as the teller. Set the stage by putting all the clues together into a fun Adventure Pack, adding some storage bags to collect cool rock and stick samples along with a crayon and paper in case they want to draw pictures of any cool finds. Be sure to hype the hike as a science adventure trying to track down all the clues in the Adventure Pack.

Have a great adventure!
Related Posts with Thumbnails