Monday, December 20, 2010

Smart Stuff with Twig Walkingstick: Where do deer sleep during winter?

 Twig Walkingstick lives in and around the Wooster campus of the Ohio Agricultural Research and Development Center. His alter ego is Kurt Knebusch, one of our super-talented writers and editors on campus. Each month, look for Twig to answer a reader questions and some additional interesting facts below. After Twig's post, we will be providing some ideas and suggestions on how to incorporate the info in Twig's column into fun science learning for your students and children.

Q. Dear Twig: Where do deer sleep during winter?

A. In two kinds of places. The choice depends on whether it's daytime or nighttime. (I assume here a cold, snowy winter where the deer is. Are.)

At night, deer tend to sleep near coniferous ("kuh-NIFF-er-us") trees. (Coniferous trees you know might include pines, firs, spruces and hemlocks.) A usual spot is next to a trunk under thick, low, sheltering branches. The branches serve as a roof and a blanket. They keep out the wind, slow down how fast heat gets lost and help the deer save energy. A key for a deer to survive winter is to save energy.

During the day, deer sleep more in the open, away from deep, dark woods, a lot of times on a fill facing south or west. Why: To be in the sun. The sun's heat makes them warm. Or at least not as cold.

The technical term for both places is "bed sites." Deermay "bed" —lie down, sleep, or just hunker down and relax—at times throughout the day or night.

Long winter's nappilu,
Twig

P.S. Ohio's native deer is the white-tailed deer. Out west look for mule deer. Also, mules.


Notes from Twig: 
  • Mules, but not mule deer, like in Ohio too of course. And in many other places, such as "Hee Haw."
  • Subspecies of the mule deer (note: not a mule) are the Sitka deer (ditto) and black-tailed deer (ditto ditto). White tailed subspecies are the Coues (said "cooze." "cows" or "coos," depending on who says it) deer and Florida key deer.
  • Sources included "Winter Bed-site Selection by White-tailed Deer in Central Ontario," Journal of Wildlife Management, 1983.
  • Ohio State's experts on deer and wildlife management in general, but not mules, work in the School of Environment and Natural Resources, specifically in the Terrestrial Wildlife Ecology Laboratory.

--

Using this information for education:
Many students are preparing to celebrate the holiday season and dreaming of what they may find under the Christmas tree. Unlike the Christmas trees inside homes which have presents underneath them, nature's Christmas trees (pines, hemlocks and firs to name a few) are often a present to wildlife in and of themselves. 

Written by Colleen Monroe, A Wish to be a Christmas Tree is a fun holiday read that recounts the tale of a pine tree that has grown too large to ever be picked by a family as a Christmas tree. As he begins to cry, his woodland-creature-friends share how important he is to them...how he provides shelter from the storms with his branches, bedding for deer, and many other important benefits. Still sad, the tree is cheered when the animal s decorate him on their own and make him their own special Christmas tree.

This is a fun book to read during the holiday season, because it teaches the importance of friendship and helping others, but children can also learn about the important ecological functions of trees for wildlife in a fun way. And that includes providing cozy beds for deer in winter. Thanks, Twig!

Monday, December 13, 2010

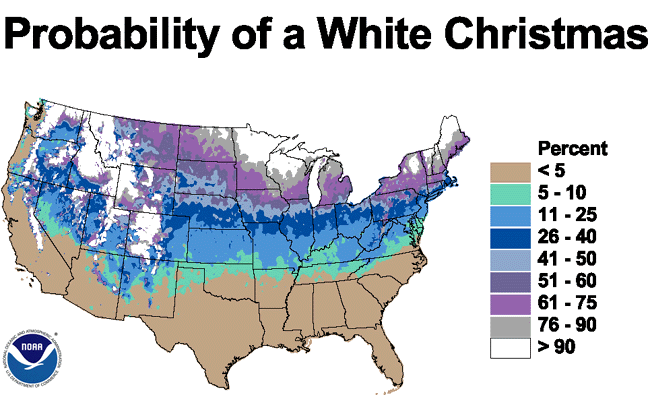
Dreaming of a white Christmas?

Are you (and your little learners) dreaming of a white Christmas? How about if you take those dreams and turn them into predictions?

Here at OARDC we have an active weather station at our Wooster campus, and at 17 other sites across the Buckeye State. Current and past data for these stations is available free of charge online. So you can certainly check our weather at anytime, but that still leaves the question: will we have a white Christmas this year? Here's a fun way for older elementary to high school students to use historical weather data to create a map and color key to illustrate the likelihood of a white Christmas while learning about contour maps. The following lesson plan is based on the lesson available at educationworld.com
The National Climatic Data Center has calculated the probability of a White Christmas for the entire US (below). This map is based on the full range of data for each site rather than the 1971-2000 normal.

Here's what you'll need:

  • A color temperature map (many newspapers like USA Today publish such a map daily and are even available online)
  • Recording of the song I'm Dreaming of a White Christmas  (optional)
  • White Christmas Weather Data worksheet available free online
  • US outline map available free online
  • Atlas
  • Crayons or colored pencils
Will your students enjoy a white Christmas this year? Let's see what the historical weather data has to say about the likelihood for your part of the country...
  1. Start by showing students a color temperature map. Discuss how the map can be a quick guide to determine the current or high temperature for the day. Point out the color key as a tool to guide interpretation of the map.
  2. Ask students if they have any idea how this map, called a temperature contour map, is created. The color contour map is imply a pictorial representation of weather data. In the case of a contour map that shows the current temperatures around the United States, the data is a long list of temperatures in cities around the country. Students could create their own color contour map by gathering this data, plotting the temperatures in a wide variety of locations on an outline map and "connecting the dots" to approximate the approximate areas in which the temperatures are in the 20s, 30s, 40s, 50s, etc.
  3. For practice, you may want to provide students with data from a local paper on temperatures recorded the previous day or the high temperature estimate for the current day. Use the list to plot locations and temperatures. Demonstrate how students can create a color contour map to show those high temperatures. Then have students map the low temperatures of the day from the same source.
  4. Introduce and play the song I'm Dreaming of a White Christmas and pass out the White Christmas Weather Data worksheet. This worksheet includes figures representing the percent likelihood of snow being on the ground Christmas Day in 40 cities around the United States. This worksheet is intended for grades 5 and up. Younger students can focus on a state or region and map data for that smaller area. For example, the Illinois State Climatologist Office provides data for 13 sites across Illinois on the likelihood of snow on Christmas day. You may be able to find similar data for your state or region as well. Stormfax also provides a nice set of data for various states and regions.
  5. Have students plot the data on their map then create a color key to guide them as they color their contour maps. The color key will denote a different color for locations where the percent likelihood of snow on Christmas day is 0-20 percent, 21-40 percent, 41-60 percent, 61-80 percent and 81-100 percent. Be sure students understand that the maps they create are a simple approximation of the likelihood any area will have an inch of snow or more on the ground Christmas day. Geographic location can account for vast differences in snowfall in a small area. For example, their map will show that much of Arizona has little chance of snow cover on Christmas day, but a small area of the state, around the city of Flagstaff ( located in the mountains in the middle of the state) has a 57 percent chance of snow coverage on Christmas day!
  6. Have students share their maps with one another and with the class and discuss how accurately those maps depict the likelihood of snow cover. Check maps for accuracy in plotting city locations, but grant leeway in judging the final contour maps. Some variation needs to be allowed for where the controus might break between the plotted cities. Students should also have the opportunity to express in writing thelessons they learn (math and geography) from the activity.

Monday, December 6, 2010

Let's make trees!

I've been brave enough to commit to working with two Head Start centers this year on a monthly basis, working with their children on science and agricultural literacy. Besides the basics of learning where their food comes from, I want these children to understand the incredible diversity of American agriculture and to be excited about science and all the wonderful things just waiting to be discovered by their young minds.

So far this year, I've shared with them about insects and spiders (just in time for Halloween...and let me tell you, I was impressed with what those preschoolers already knew when I got there!). Then we talked about the life cycle of a pumpkin and read some cool pumpkin books (you can't believe what a great job they are doing of growing their pumpkin seeds!). And in November we learned about the different body parts and adaptations of wild turkeys. I'm telling you, these preschoolers are impressive and already knew what a turkey's caruncle was before I was even walked in the door! So I thought they deserved an extra fun treat as Christmas approaches.

We did our December visit on Christmas trees!

We started out by talking about how Christmas trees are grown on farms, how they benefit the environment by absorbing carbon dioxide and releasing fresh oxygen, how they are a renewable resource, how they are recyclable, and how they preserve green space. The National Christmas Tree Association has some great resources on their site with this information as well as a lot of myths debunked about real Christmas trees. For example, did you know there are more than 4,000 Christmas tree recycling programs in the United State alone?

Then we read A Wish to be a Christmas Tree by Colleen Monroe.
This cute tale tells the story of an old tree on a Christmas tree farm that is sad because he was never chosen by a family to be a Christmas tree. He knows now that he's too large to be chosen by a family to be their Christmas trees, but the animals tell him all about the many benefits he provides to them and while he is asleep, they decorate him and make him their own special Christmas tree.

Afterwards, we made our own little Christmas tree snacks. We started with Cool Whip, which I colored with green food coloring in advance. Each child then got their own sugar ice cream cone and "iced" the cone with the Cool Whip to make a tree. We decorated the trees with M&Ms for ornaments and enjoyed a good snack. This is a fun little treat either in the classroom or at home. So enjoy!

Monday, November 29, 2010

Tree-rific math!

This month I'm gearing up for a big lesson on Christmas trees with about 200 preschoolers. Lucky me, right? But as I was out looking for "the perfect idea" for sharing about the role of Christmas trees and Christmas tree farmers with my preschool crowd, I found a cool resource for teaching real-life mathematics to older students using Christmas trees!

Photo from the United States Department of Agriculture
Natural Resource Conservation Service
The lesson comes from the Massachusetts Christmas Tree Association, and they offer an educational package free of charge (you just pay $5 for shipping) called The Annual Cycle of the Tree Farmer. If the rest of the materials are as cool as this fun, hands-on lesson, the $5 shipping fee is a steal!

Students will develop and understanding of area,the size of an acre and spatial relationships as well as learn different strategies for determining land area of irregular polygons in this lesson designed for students in grades 6 and up (adaptations for younger students are included at the end of this lesson).

The assignment revolves around this scenario:

Mr. & Mrs. Rice recently sold their dairy her and want to convert their former pasture land into a tree farm. They have a map of their property that shows the pasture land. Literature from the Massachusetts Cooperative Extension agent about growing evergreen trees suggests that trees can be successfully grown in a 6' x 6' arrangement with trees planted 6' apart in rows that are 6' apart. With this arrangement, 1,200 trees can be planted per acre of pasture land. An acre is a surface are of 43,560 feet.

Side note: I love the name Rice used in the scenario above! The land where our OARDC campus is located originally belonged to the Frederick Rice family. Frederick was a veteran of the Revolutionary War and eventually divided the farm between his two sons Simon and Barnhardt.


Question for students to answer: How many trees can the Rice family plant in their former cow pasture? A map of the property is included in The Annual Cycle of the Tree Farmer package.

Suggestions for teaching:

  1. Take the students outside and measure an acre on your school or personal property to help them understand how large an acre actually is. Before going outside, explain that since the square footage of an acre is 43,560 feet, the easiest way to measure out an acre is to create a square or rectangle with an area this size (Area = Length x Width, and in this case the area would be 43,560). Have students experiment in the classroom with calculators to find what combination yields a product of 43,560. Just a few of the possible solutions include: 208.47 x 208.47, 10 x 4,356, 100 x 435.6, 150 x 290.4, etc. Students should discover that the width will always equal the area (43,560 feet) divided by whatever length they choose. The students can then be divided into groups of 4 to go outside, measure and stake out the bounds of their acre using different dimensions for each group. This will help them understand that several different polygons can have the same area (in this case, 1 acre).
  2. Divide the students into groups of 3-4 and distribute the maps of the farm showing the pasture land that is to be planted to trees. Focus on 1 pasture and show it on an overhead. Give students 5 minute to discuss with their group possible ways to find the square footage of this pasture, then present their solutions. If using the map included with the Annual Life Cycle of a Tree Farmer, the lengths on that map have been converted to actual lengths using the map scale, where 1 inch = 100 feet. If you don't have the Annual Life Cycle of a Tree Farmer, you can create your own map selecting pasture shapes appropriate to the age level of your students. Perhaps the pasture shape is a trapezoid (calculate the area by dividing it into 2 triangles and a rectangle, then add the areas together) or a series of different shaped rectangles
These are fun, hands-on ways to help students learn about basic mathematical concepts and real-life problem solving. Which is always a good idea when it comes to minimizing the "But why do I have to learn my math?" questions! 

Monday, November 22, 2010

Smart Stuff with Twig Walkingstick: Turkey Beard? Weird!

Our favorite guest blogger is back again and this time he's talking turkey. It's Twig Walkingstick!  Twig lives in and around the Wooster campus of the Ohio Agricultural Research and Development Center. His alter ego is Kurt Knebusch, one of our super-talented writers and editors on campus. Each month, look for Twig to answer a reader questions and some additional interesting facts below. After Twig's post, we will be providing some ideas and suggestions on how to incorporate the info in Twig's column into fun science learning for your students and children.

Q. Dear Twig: Did you know that turkeys have beards?

A. Actually, I did know that. And I don't get to say that very often. Ha! Wait, not funny.

The "beard" of the turkey hangs down from the middle of the turkey's chest. It doesn't hand down from his chin. Though that would be cool if it did. It looks like a long, skinny, long-haired tail. Like the tail of a horse if the horse were as big as a miniature poodle and the tail were on the front, not the back. Scientists call the "hairs" of the beard "bristles of  "mesofiloplumes" ("MEZ-uh-FILL-uh-ploomz") - stiff, feather-like structures.

A male turkey, called a tom, starts to grow a beard at about 11 weeks old. The beard gets longer as the tom gets older. Sometimes it gets up to 12 inches long. It helps the tom attract females, or hens. A big, long beard means a big, strong tom. Or at least an older one. One that knows what it takes to survive, to not get eaten by a fox or an owl, and live to a long-bearded age. Hens dig that.


Gallopavically,
Twig

P.S. The wild turkey's scientific name: Meleagris gallopavo. Some hens have beards, too.


--

Notes from Twig: 
  • In the wild, in wild turkeys, most toms and some hens have beards. Also: some toms have more than one!
  • On farms, in farm turkeys, some toms don't have beards, some hens have them, and either way most of those beards are shorter than the beards of wild turkeys in the wild. (Wild!)
  • To learn just about everything you might ever want to know about turkey beards, read The Beard of the Wild Turkey by A.F. Schorder in the October 1957 issue of the journal The Auk. (Wing bump to the Pennsylvania chapter of the National Wild Turkey Federation for the tip!)
  • Keen on turkeys? Want to try raising one? Try the Ohio 4-H Project #166, Raising turkeys.
You can clearly see the beard on the chest of this eastern subspecies of wild turkey.
Photo courtesy of Larry Price and the National Wild Turkey Federation.

Using this information for education:
This is a great time of year for students to learn about turkeys and have some fun, too! Thanksgiving is a great time to learn about the differences between today's domestic turkeys and wild turkeys. You might not this so, but the difference is huge...and it's not just the color difference!

For a fun activity to teach students about the purpose of the difference features and characteristics of wild turkeys and a little more about the science of adaptation, be sure to check out our post from earlier this month on turkey survival!

Tuesday, November 16, 2010

Preparing for the feast

I don't know about you, but my kids are ready for Thanksgiving. Whether it's the turkey, the pumpkin pie, the days off school or the "official" start of the Christmas season, they are ready. So while their minds are on the upcoming feast anyway, it's a perfect time to practice reading charts, interpreting data and learning about how important agriculture and food production are to state's economies. Here in Ohio, agriculture is the largest industry in the state. That makes it pretty important!


Let's start by taking a moment to look at just a few of the "staples" of a traditional Thanksgiving feast:

Turkeys
The United States is the world's largest producer of turkeys. So where are these birds raised? Here are the top 10 turkey producing states in the country with the number of birds raised in each

  1. Minnesota: 48 million
  2. North Carolina: 40 million
  3. Arkansas: 31 million
  4. Missouri: 21 million
  5. Virginia: 18 million
  6. California: 16 million
  7. Indiana: 14.5 million
  8. South Carolina: 12.5 million
  9. Pennsylvania: 11.5 million
  10. Iowa: 9 million
Source: United States Department of Agriculture 2008 numbers. Print off the chart from the USDA, page 7, and ask students to rank the top 5 or top 10 turkey producing states either by total dollar value, number of turkeys, or even the average price per pound in each state. 

Follow up by asking age-appropriate questions, like how many turkeys are raised on farms in Indiana? Which state produces more turkeys, Arkansas or Virginia?  Which state produces the most turkeys? Which state produces fewer turkeys, Missouri or California? How many more turkeys are produced in Indiana than South Carolina? How many turkeys are produced in the three top turkey-producing states?

Even more fun? Take a look at the blog On the Banks of Squaw Creek to hear the tales of our teacher and blogger friend Katie,  who lives on one of those turkey farms responsible for making Iowa a top-ten turkey-producing state. She tells lots of turkey tales and has cool pictures of what modern turkey production looks like.

Education World has a worksheet available for download on sweet potato and cranberry production that explores similar questions, too.

Another great tool to look at is the American Farm Bureau's annual Thanksgiving basket survey. Each year they shop for the same list of Thanksgiving feast staples to estimate the cost of preparing a Thanksgiving dinner. The list remains the same from year to year, so students can look at the relative costs over time and chart those as well. They can also track inflation over time and compare those results as well.

Wednesday, November 10, 2010

Students will "gobble" up this food web

Wondering how to make learning about food webs fun for your students? Here's an activity perfect for November (when we're all dreaming up the upcoming turkey dinner) where students will investigate the concepts of food webs and food chains. This is alos a great opportunity for them to learn about and describe the role of wild turkeys, plants and other organisms in cycling energy and matter. Another plus? this activity is easily adaptable for students in kindergarten through 8th grade and addresses science and environmental education national learning standards.

This photo of a Rio Grande subspecies of wild turkey is courtesy of the National Wild Turkey Federation
So what are food webs? Basically, food webs are the feeding relationships among the different species in a community. Each member of a community can be classified as either a consumer or a producer. Producers, well, produce energy—generally from the sun through photosynthesis. Producers harness the sun's energy to make their own food. On the other hand, consumers are those members of the community who consume energy by eating other organisms. Producers are the base of the food chain and very important, because all of the energy in the community originates with them.


Start off by discussing the definitions of producer and consumer and have students list examples of each, Write the name of each producer and consumer on an index card (1 per card) and tape each piece to the chalkboard or whiteboard. To make it even easier, you can print off these printable cards with list numerous members of the community, whether they are a producer or consumer, and what they eat. Younger students might find it easier to understand if each animal were represented by a pictureYou and your students may also be interested in learning more about wild turkey predators in particular for this lesson.

Then have the students come to the chalkboard and draw lines to show the energy chains.  You can also place the cards on the floor and connect them with yard. Students can then physically walk through a specific energy chain in the food web. Students can then record their specific chain on a piece of paper or in a science journal.

Once each student has recorded their chain, the teacher can pull an organism from the web. Have students discuss which food chains the removed organism affected. Repeat with other organisms from the chain and continue to discuss.

To add a fun twist, replace all the organisms in the food web and have students secretly select and record a second energy chain. Once each students has recorded their new secret food chain, the teacher slowly randomly begins to remove and organism. After the first organism is removed, record who is "dead" and who is "alive." Continue to remove organism and record the casualties and survivors until all the energy chains have been eliminated.

Here are some questions for discussion:

  • What did the students notice when all the organisms had died?
  • What strategies to herbivores use to avoid being captured? Answers will vary, but examples might include mimicry, mobbing behavior, camouflage coloration, safety in numbers, physical or chemical combat, etc.
  • What strategies do carnivores use to capture their prey? Again, answers will vary but might include binocular vision, sharp teeth, heightened sense of smell, sharp claws, camouflage coloration, hunting in groups, physical or chemical combat, etc.
  • How do organisms compete for food? Organisms usually compete for food through adaptations, performance, heard-to-head competition, or predatory competition. Students' answers may vary. For more on the adaptions of wild turkeys, be sure to check out our post from last week called "This turkey is staying alive!"
  • What would happen if there were more predators or prey in a particular community? Explain. Answers may vary, but could include overpopulation of species, which would lead to an increase in disease and a decrease in available food and space for that species.
  • How might humans affect the food web? Humans could negatively impact the food web through pollution and habitat destruction. However, humans can also positively impact the food web through habitat creation, establishing wildlife areas, and helping to control overpopulated species. It's important for students to realize not all human intervention is bad.
This lesson was based on and adapted from the "Turkey Web"activity found in the National Wild Turkey Federation's Wild About Turkeys k-12 curriculum and activity guide.
Related Posts with Thumbnails